推荐学习书目
› Learn Python the Hard Way
Python Sites
› PyPI - Python Package Index
› http://diveintopython.org/toc/index.html
› Pocoo
值得关注的项目
› PyPy
› Celery
› Jinja2
› Read the Docs
› gevent
› pyenv
› virtualenv
› Stackless Python
› Beautiful Soup
› 结巴中文分词
› Green Unicorn
› Sentry
› Shovel
› Pyflakes
› pytest
Python 编程
› pep8 Checker
Styles
› PEP 8
› Google Python Style Guide
› Code Style from The Hitchhiker's Guide

这是一个创建于 2034 天前的主题,其中的信息可能已经有所发展或是发生改变。
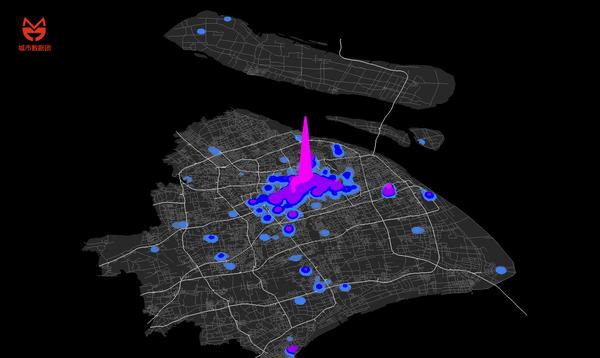
这种在空间基础上的尖峰图。
 |
1
yuikns 2020-03-01 22:41:10 +08:00
如果要 python 的话,试试 matplotlib ? see: https://matplotlib.org/mpl_toolkits/mplot3d/tutorial.html
不过还可能可以试试生成一个 three.js see: https://threejs.org/ |
|
2
yuikns 2020-03-01 22:42:06 +08:00
|

 |
4
cmingxu 2020-03-02 14:56:05 +08:00
opengl
|