
这是一个创建于 926 天前的主题,其中的信息可能已经有所发展或是发生改变。
如题,需求如下图,实现这样一个图表,目前实现了环形图,但是渐变卡住了。
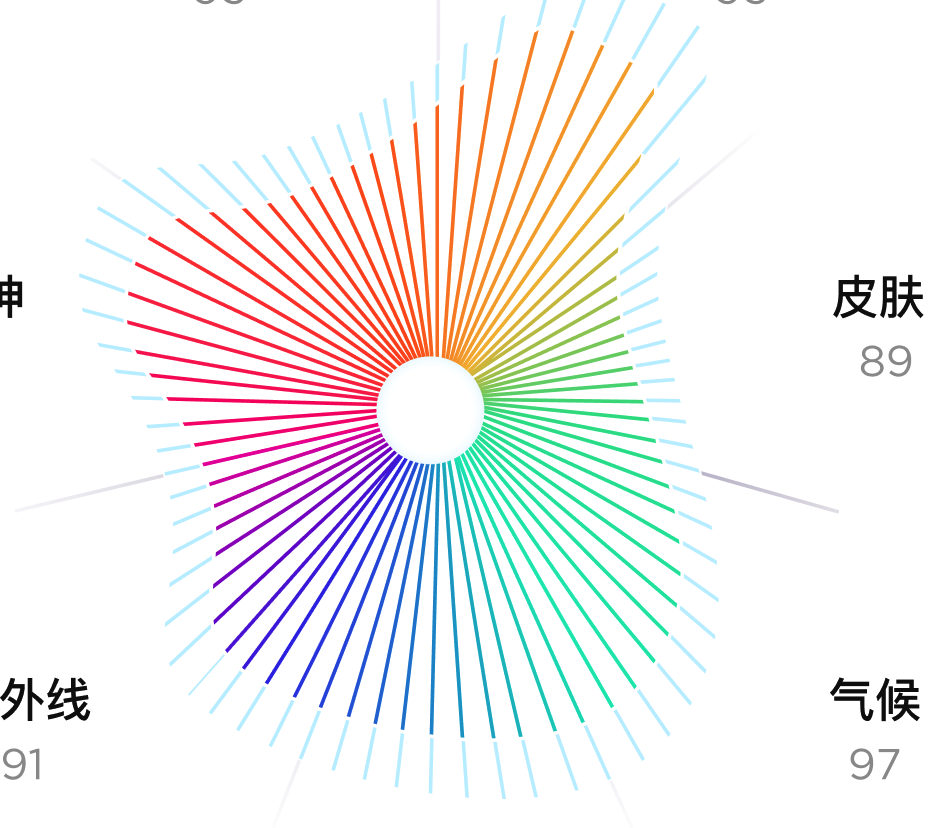
设计稿:
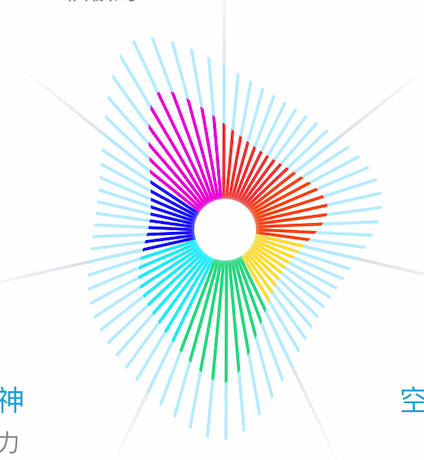
目前实现:
迫于不精通 Canvas ,想请教 v 友如何实现这样的环形渐变。
代码如下
    async drawCanvas () {
      await Taro._helper.waiting(200)
      var exer_data = (this.archive.score_exercise - 60) * 12;
      var skin_data = (this.archive.score_skin - 60) * 12;
      var climate_data = (this.archive.score_climate - 60) * 12;
      var AQI_data = (this.archive.score_air_quality - 60) * 12;
      var uv_data = (this.archive.score_uv - 60) * 12;
      var Mind_data = (this.archive.score_mind - 60) * 12;
      var Nutrition_data = (this.archive.score_nutrition - 60) * 12;

      wx.createSelectorQuery()
      .select('#myCanvas') // 在 W
      .fields({ node: true, size: true })// XML 中填入的 id
      .exec((res) => {

        const blob = (mask) => {
          ctx.beginPath()
          mask(data)
          ctx.clip()
        }

        const drawBars = (opacity, thickness, radius, shadow = false)  => {
          ctx.rotate(3.1)
          let colors = ["#F84F45", "#FE5C1E", "#FFE145", "#2EDC90", "#1CEEFC", "#3033FC", "#F117DB"];
          let t = -1
          // const gnt = ctx.createLinearGradient(0, 134, 20, 134)
          // gnt.addColorStop(0/6, colors[0])
          // gnt.addColorStop(1/6, colors[1])
          // gnt.addColorStop(2/6, colors[2])
          // gnt.addColorStop(3/6, colors[3])
          // gnt.addColorStop(4/6, colors[4])
          // gnt.addColorStop(5/6, colors[5])
          // gnt.addColorStop(1, colors[6])

          d3.range(totalBars).forEach(i => {
            ctx.rotate(barThickness)
            if (i % 2 === 0) {
              // if (i % bars === 0) {
              //   ctx.fillStyle = 'rgba(255,255,255,0)'
              // } else {
              //
              // }
              if (parseInt(i % 20) == 0) {
                t++
              }
              if (shadow) {
                ctx.fillStyle = d3.rgb('#C2EFFF')
              } else {
                // ctx.fillStyle = gnt
                ctx.fillStyle = d3.rgb(colors[t])
              }
              ctx.fillRect(0, 0, thickness, radius)
            }
          })
        }

        const drawCircle = (radius)  => {
          ctx.beginPath()
          ctx.shadowOffsetX = 0;
          ctx.shadowOffsetY = 0;
          ctx.shadowBlur = 8;
          ctx.shadowColor = '#DDF4FF';
          ctx.fillStyle = 'white'
          ctx.arc(0, 0, radius, 0, 2 * Math.PI)
          ctx.fill()
        }

        var c = res[0].node
        var ctx = c.getContext('2d')

        const dpr = wx.getSystemInfoSync().pixelRatio
        c.width = res[0].width * dpr
        c.height = res[0].height * dpr
        ctx.scale(dpr, dpr)

        var data = [exer_data, skin_data, climate_data, AQI_data, uv_data, Mind_data, Nutrition_data];
        var width = res[0].width

        var category = 7
        var bars = 20
        var totalBars = category * bars

        var innerCircleRadius = 20
        var barHeight = (width - 60)/2
        var shadowInnerCircle = innerCircleRadius - 20
        var shadowBarHeight = barHeight + 10
        var extent = d3.extent([0, 500])
        var barThickness = 2 * Math.PI / totalBars
        var barWidth = 40 * barThickness
        var shadowExtent = d3.extent([0, 500 + 30])
        var scales = {}

        scales.bar = d3.scaleLinear().domain(extent).range([innerCircleRadius + 5, innerCircleRadius + barHeight - 15])
        scales.shadow = d3.scaleLinear().domain(shadowExtent).range([shadowInnerCircle, shadowBarHeight])

        scales.bar.range([0, innerCircleRadius + barHeight - 20])

        var masks = {}
        var categoryArcThickness = 2 * Math.PI / 7
        var categoryMaxOffset = categoryArcThickness * 0.5

        masks.bar = d3.radialLine()
        .radius(d => {
          return scales.bar(d)
        })
        .angle((d, i) => {
          return (i * categoryArcThickness) - categoryMaxOffset
        })
        .curve(d3.curveCardinalClosed)
        .context(ctx)

        masks.shadow = d3.radialLine()
        .radius(d => {
          return scales.shadow(d) + 25
        })
        .angle((d, i) => {
          return (i * categoryArcThickness) - categoryMaxOffset
        })
        .curve(d3.curveCardinalClosed)
        .context(ctx)

        ctx.translate(width / 2, width / 2)

        ctx.save()
        ctx.setTransform(1, 0, 0, 1, 0, 0)
        ctx.clearRect(0, 0, 3 * width, 3 * width)

        ctx.restore()
        ctx.save()

        ctx.beginPath()
        ctx.rotate(3.1)
        d3.range(totalBars).forEach(i => {
          ctx.rotate(barThickness)
          if (i % 2 === 0) {
            if (i % bars === 0) {
              const gnt = ctx.createLinearGradient(0, 0, 0, width/2)
              gnt.addColorStop(0, '#C7C3D2')
              gnt.addColorStop(1, '#FFFFFF')
              ctx.fillStyle = gnt
              // ctx.fillStyle = 'rgba(230,230,230, .5)'
              ctx.fillRect(0, 0, 1.5, width/2)
            } else {
            }
          }
        })

        ctx.restore()
        ctx.save()
        blob(masks.shadow)
        drawBars(1, 1.5, 200, true)
        ctx.restore()
        ctx.save()
        ctx.beginPath()
        blob(masks.bar)
        drawBars(1, 1.5, 200)
        ctx.closePath()
        drawCircle(innerCircleRadius - 5)
        ctx.restore()
        ctx.save()
      })
    }
如果可以直接有偿帮我完成这个需求就更好了 XD
详聊绿色:Y2FsaWJ1b3Jz
 |
1
codehz 2022-11-24 23:29:36 +08:00 via iPhone RGB 不好渐变,用 HSL 不就好了,直接把角度填上去)
|
 |
2
Aloento 2022-11-24 23:30:48 +08:00 《神力》
|
 |
3
mayliya 2022-11-25 00:35:10 +08:00 蹲一个解决方案,学习学习🙃
|
 |
4
Imindzzz 2022-11-25 00:52:20 +08:00 代码没注释没看。我的思路是渐变画底图,用上面这些长条去剪辑,可以参考刮刮乐的实现方式,主要 api 是 globalCompositeOperation
https://juejin.cn/post/6844903926899163150 不过你这个渐变有点特别,又是线性的又是经向的,我不知道用代码怎么画,那底图可以直接用图片, 我都不知道设计师是画出来的,可以问问他思路,最好能把底图也用代码画出来。 |
 |
5
tool2d 2022-11-25 01:36:55 +08:00 SVG 很容易实现 path 渐变色。
|
 |
6
chaoschick 2022-11-25 07:56:15 +08:00 via Android 我觉得如果单个线条上也要有渐变色的话,可以先渐变的环,然后画白条。如果单个线条是单一颜色,可以画一个隐藏的 canvas 线性渐变条,然后用长条所处的度数除以 360 ,然后用这个数从线性渐变条获取对应的颜色值(大概就是这个意思吧)
|
 |
7
Mutoo 2022-11-25 08:06:30 +08:00 圆锥渐变跟射线同心的话,射线上的颜色是不会变的。两个颜色之间的插值用 hue interpolation 比 rgb interpolation 要好。
https://www.alanzucconi.com/2016/01/06/colour-interpolation/ |
|
8
Imindzzz 2022-11-25 08:59:52 +08:00 |
 |
9
Seaony OP @chaoschick 感谢,研究了一天,最后的实现方案是线条本身颜色不变,单独写了个 canvas 渐变长条提取了所有线条的颜色,然后写死在代码里了
|